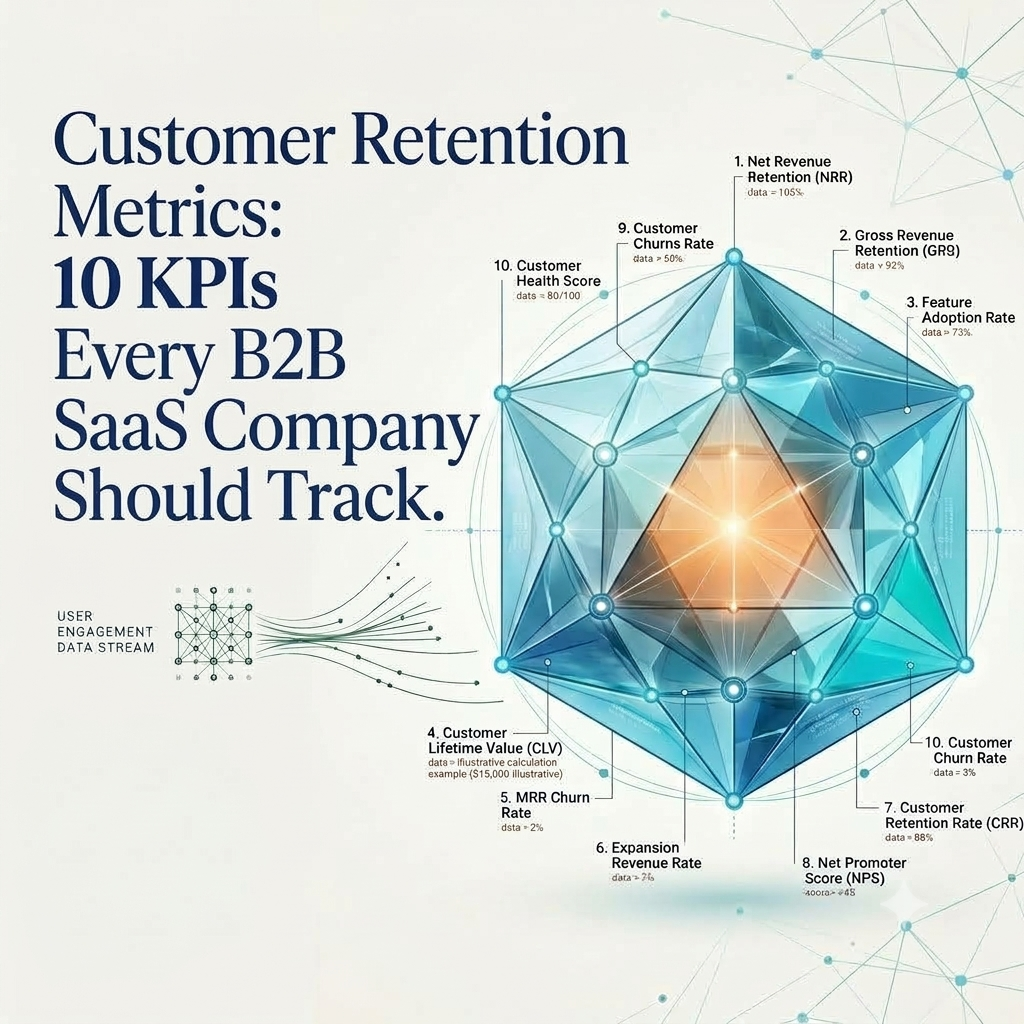
Customer Retention Metrics: 10 KPIs Every B2B SaaS Company Should Track

A customer retention metric shows whether a B2B SaaS company is keeping, losing, or growing revenue from its existing customers. That matters because subscription growth does not end when a deal closes.
Your team closes a $60,000 deal in March. By December, the customer has halved its seats and stopped logging in on Fridays. Nobody flagged it because the dashboard only tracks new bookings.
Acquisition brings in new revenue, retention protects the revenue you have, and expansion grows the value of existing accounts. That’s why the right customer retention metrics matter. Retention also ranks among the SaaS growth metrics boards watch, because it shows how much growth comes from existing accounts.
The sections below take you from the basics of each metric to its calculation, benchmark, measurement cadence, and the actions that can improve it.
What you'll learn
- What the 10 key customer retention metrics measure and how to calculate them
- How to interpret each metric and compare it with relevant benchmarks
- When to measure each metric and who should own it
- Which retention and expansion plays can improve the numbers
What are customer retention metrics?
SaaS customer retention metrics are quantitative indicators of whether customers keep using your product, renew, expand, and recommend it. They come in three types: customer retention counts accounts, revenue retention counts dollars, and user retention counts product usage. Teams that track user retention metrics look at logins, active accounts, and feature use.
They also split by timing. Most SaaS retention metrics lag because they report what already happened, like churn and NRR. Onboarding completion, feature adoption, and support sentiment can lead, signaling potential risk before a customer leaves. A useful retention metric set includes both, and a customer retention metric without a time window means little.
Retention vs. customer success metrics
Retention metrics measure whether customers stay and continue generating revenue, while customer success metrics measure customer health and progress toward desired outcomes. A distinction helps teams understand both the outcome and the factors influencing it.
A customer can rate you highly and still leave when budget gets cut, so report the three groups separately. Customer loyalty metrics describe the relationship; retention describes the contract.
The 10 customer retention KPIs every B2B SaaS company should track
The 10 B2B SaaS retention KPIs fall into four groups: revenue retention (NRR, GRR, revenue churn, expansion revenue), customer retention (customer retention rate, customer churn, logo retention), customer value (CLV), and customer behavior (product adoption and health score).
No single B2B SaaS metric shows the full picture. Reviewing these B2B SaaS retention KPIs together helps teams track revenue, customer loss, account value, and early signs of risk.
The examples below use the same hypothetical company: 200 customers generating $100,000 in starting MRR (Monthly Recurring Revenue) to explain the KPIs.
1. Net revenue retention (NRR)
Net revenue retention measures how much recurring revenue remains from existing customers after churn, contraction, and expansion.
NRR = (Starting MRR + Expansion - Contraction - Churned MRR) / Starting MRR × 100
If the company starts with $100,000 MRR, gains $12,000 in expansion, loses $3,000 to contraction, and loses $5,000 to churn, NRR is 104%.
The 2025 median across 342 companies was 102%. SaaS Capital's benchmarks also show stronger NRR among higher-performing bootstrapped companies. NRR above 100% means the existing customer base is growing before any new customers are added. The usual mistake is celebrating NRR without checking GRR.Treat net revenue retention as the headline B2B SaaS metric for existing-customer growth, and confirm it with GRR.
2. Gross revenue retention (GRR)
Gross revenue retention shows how much starting revenue remains after churn and contraction. Unlike NRR, it excludes expansion and cannot exceed 100%.
GRR = (Starting MRR - Contraction - Churned MRR) / Starting MRR × 100
Using the same example, $3,000 in contraction and $5,000 in churn leaves $92,000 of the original $100,000 MRR, giving a GRR of 92%.
GRR is the better metric for seeing whether the existing revenue base is holding before expansion masks losses.
3. Customer retention rate (CRR)
Customer retention rate measures the percentage of customers retained during a period, excluding new customers.
CRR = (End customers - New customers) / Start customers × 100
If the company ends the period with 215 customers after adding 25 new ones, it retained 95% of its original 200 customers.
For annual contracts, use an annual or cohort view. Customer retention rate also pairs well with renewal rate because retention counts customers while renewal tracks contracts coming up for renewal. Account-level client retention metrics show which customers drive the movement.
4. Customer churn rate
Customer churn rate measures the percentage of customers lost during a period.
Customer churn rate = Customers lost / Customers at start × 100
If 10 of the company's 200 starting customers leave, its churn rate is 5% for that period. Monthly churn can be misleading for annual contracts, so compare it with your contract structure and customer segment. Tag each loss by cause, whether poor fit, onboarding, adoption, budget, competitor, product gap, support, or M&A, to turn the churn number into something the team can act on.
5. Revenue churn rate
Revenue churn rate shows how much recurring revenue was lost through both customer churn and contraction.
Revenue churn rate = (Churned MRR + Contraction MRR) / Starting MRR × 100
For example, $5,000 in churn and $3,000 in contraction produces 8% gross revenue churn on $100,000 of starting MRR.
Read your SaaS churn rate by both logo and revenue:
6. Logo retention rate
Logo retention rate measures the percentage of customer accounts retained over a period.
Logo retention rate = (Starting logos - Lost logos) / Starting logos × 100
If 10 of the company's 200 customers leave, logo retention is 95%. Logo retention is particularly useful in product-led, SMB, and land-and-expand motions. It should sit beside NRR because a company can retain most of its logos while losing a disproportionate amount of revenue from a few large accounts. That is why enterprise teams often track client retention metrics account by account.
7. Customer lifetime value (CLV)
Customer lifetime value estimates the gross profit a customer generates over the expected relationship.
CLV = ARPA (Average Revenue Per Account) × Gross margin / Customer churn rate
With $500 in monthly ARPA, an 80% gross margin, and 1% monthly customer churn, estimated CLV is $40,000. Use customer lifetime value by segment, tier, channel, and cohort rather than relying on one company-wide number. A $12,000 CAC against a $40,000 CLV produces an LTV:CAC ratio of 3.3:1.
8. Expansion revenue rate
Expansion revenue rate measures additional recurring revenue generated from existing customers through upsells, additional seats, increased usage, or add-ons.
Expansion revenue rate = Expansion MRR / Starting MRR × 100
If existing customers add $12,000 in MRR to the starting $100,000 base, the expansion revenue rate is 12%. Expansion revenue feeds directly into NRR and is one of the SaaS growth metrics that Sales and Customer Success can influence together.
9. Product adoption and engagement rate
Product adoption and engagement metrics show whether customers are using the product in ways that support retention. They are leading retention KPIs, so they can surface risk before churn appears in the revenue data.
Track activation rate, core feature adoption, active account rate, and depth of use. Define activation around the customer's job to be done rather than a simple login. These user retention metrics show behavior before revenue changes.
For example, if 75 of 200 customers complete the defined activation milestone, the activation rate is 37.5%. A decline in logins, empty seats, unfinished onboarding, or rising support tickets can then flag accounts that need attention. Technource reports that the median activation rate for B2B SaaS companies is 37.5%.
10. Customer health score
A customer health score combines several signals to estimate the likelihood that an account is healthy, at risk, or ready for intervention.
A practical score might weight the signals like this:
For example, a score of 80+ could flag a healthy account for an expansion conversation, 60–79 could prompt CSM outreach, and below 60 could trigger a risk review or escalation. These thresholds are illustrative and should be calibrated against your own historical renewal and churn data rather than treated as universal benchmarks.
The best customer health score is one that has been back-tested against past churn. It turns a collection of B2B SaaS retention signals into an early-warning system the team can act on.
Supporting retention metrics worth monitoring
Supporting retention metrics add context to the core KPIs. CSAT measures satisfaction with a specific interaction, CES measures how easy it was for customers to complete a task, and NPS measures willingness to recommend the company. NPS is often used as a customer loyalty metric; B2B SaaS NPS medians cluster around 36, with 40 or higher generally considered good. Pair NPS with other customer loyalty metrics, such as referrals and testimonials, instead of reading it alone. Renewal rate measures the percentage of customers or contracts renewed during a given period and should be tracked separately from expansion. These metrics help explain retention outcomes but do not replace the core retention KPIs above.
How to build a measurement framework for SaaS customer retention metrics
Step 1: define retention success by segment
Separate SMB, mid-market, enterprise, self-serve, sales-led, and product-led motions. Then set a hierarchy of B2B SaaS retention KPIs for each. Enterprise teams may lead with NRR, GRR, health scores, and multi-threading, plus client retention metrics for their largest accounts. SMB and self-serve teams may lead with activation, engagement, and user retention metrics such as weekly active accounts.
Step 2: choose a measurement cadence
Review B2B SaaS retention KPIs on a schedule that matches how fast each one moves.
Step 3: use cohorts, not blended averages
Group customers by signup month, pricing tier, acquisition channel, onboarding cohort, and company size. A blended average of SaaS retention metrics can hold steady while new cohorts get worse and old ones carry the number. Retention metrics split by cohort show the trend before the average moves.
Step 4: connect metrics to actions
Give every retention metric an owner, a trigger, and a play:
- Low activation: start an onboarding intervention.
- Declining usage: CSM outreach and a workflow review.
- Low NPS: an executive sponsor call.
- High support volume: a product or enablement fix.
- Downgrade risk: a packaging and value review.
- Strong adoption: an expansion and advocacy motion.
Customer retention dashboard: what leadership should see
Leadership should see SaaS retention metrics grouped by the question each one answers, next to the other SaaS growth metrics the board already reads. Six sections cover it.
Common mistakes with SaaS retention metrics
Common SaaS retention metric mistakes include:
- Tracking logo churn and ignoring revenue churn.
- Calling NRR healthy without reviewing gross revenue retention.
- Using company-wide benchmarks without segmenting by ACV.
- Relying on NPS alone to predict churn.
- Reviewing retention KPIs only at renewal.
- Leaving a customer retention metric without an owner.
- Reporting a B2B SaaS metric without a period or segment.
How to improve customer retention in B2B SaaS
Improve SaaS customer retention across the full customer lifecycle, from pre-sale through win-back. Set clear implementation expectations before the sale, define time-to-first-value during onboarding, track product adoption, connect business reviews to customer outcomes, and start renewal planning early. For expansion, monitor usage thresholds, identify cross-sell opportunities, and build relationships with multiple stakeholders. If a customer leaves, use structured offboarding and re-engagement to create a path back.
The formulas are only the starting point. Envizon's fractional CMO service gives B2B teams senior marketing leadership across retention, expansion, and pipeline without the cost of a full-time hire.
Book a call with Envizon to review your SaaS customer retention metrics and identify where your retention strategy can improve.
Start with activation rate, weekly active accounts, GRR or early revenue retention, churn reasons, and a simple customer health score. These give an early-stage company a practical view of whether customers are getting value and staying engaged.
NRR is usually the most important revenue retention metric because it shows how revenue from existing customers changes after expansion, contraction, and churn. GRR is useful alongside it because it shows how much revenue is retained without counting expansion.
NRR includes expansion, contraction, and churn. GRR includes only contraction and churn. NRR shows whether existing-customer revenue is growing or shrinking, while GRR shows how much revenue you keep.
Customer churn measures lost accounts. Revenue churn measures lost recurring revenue. A company can lose many small customers but little revenue, or lose one large customer and see a significant revenue decline.
100% NRR means existing-customer revenue is flat. As a directional benchmark, 110%+ is generally healthy and 120%+ is strong for many SaaS companies. The right target depends on the business and customer segment.
There is no single good rate for every SaaS company. It depends on factors such as customer segment, contract length, ACV, and business model. Use industry benchmarks as a guide, then compare them with your own historical data.
Monitor usage and customer health weekly, report revenue metrics monthly, and review cohorts and CLV quarterly. This keeps teams close to emerging risks without overcomplicating reporting.
B2B SaaS GTM strategist and Founder of Envizon. With 18+ years leading marketing across startups like iMocha, Lavelle Networks, CloudCherry, and Hotelogix, she now helps early-stage founders build GTM engines that scale.
About Envizon
Envizon helps early and growth-stage B2B SaaS startups build their go-to-market (GTM) engine, before they hire a full in-house team.We combine Fractional CMO leadership with a full-stack execution team across outbound, inbound, content, AI, paid, and PR.Not an agency. Not just advisory. Envizon acts as your internal GTM partner- bringing strategy, systems, and execution together to help founders scale faster and smarter.
Knowledge Themes
Looking for the best B2B marketing agency alternative?
Envizon combines Fractional CMO leadership with execution across all GTM channels